Is Dogecoin About to Have a Price Breakout?
After months of sluggish price action and sideways consolidation, Dogecoin (DOGE) may finally be on the verge of a meaningful breakout. Recent price action, technical signals, and broader macroeconomic trends all appear to be converging in DOGE’s favor.
Technical breakout from descending channel
According to the analysis, Dogecoin has officially broken out of the descending channel, a pattern that has limited upside since the beginning of the year. This breakout was further confirmed by a successful retest of the previous resistance level, which has now turned into support, indicating that a bullish reversal is underway.
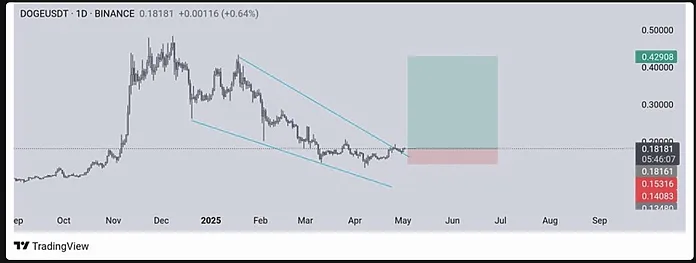
Immediate resistance lies at $0.27, but continued bullish pressure could push DOGE to $0.39 and even $0.43 in the coming weeks. Meanwhile, support around $0.17 provides a safety net in the event of a short-term pullback.
Short Term Price Action and Elliott Wave Analysis
Recent price action suggests that Dogecoin is in a micro-correction phase, currently holding above a major support zone between $0.17 and $0.1777. This zone was previously identified as a micro-support level and the market has responded accordingly, suggesting that the fifth bullish wave in the Elliott wave sequence may be beginning.
In the current wave count, analysts identify a potential three-wave bullish move, with Wave 3 peaking near the 138% Fibonacci extension level at $0.196. If this structure holds, Wave 5 could extend to the 161.8% level at $0.206 or the 178.6% level at $0.213. A confirmed break above $0.185 would mean the next leg of the rally is underway.
However, a decisive drop below $0.17 would cause a temporary pause in the expected rally. For now, the pullback appears to be corrective and shallow, consistent with the ongoing uptrend.
Macro Trends: Correlation Between Bitcoin, Global M2, and Dogecoin
Beyond the charts, macroeconomic indicators are adding fuel to the bull case. One emerging narrative that is gaining attention from analysts is the correlation between cryptocurrency prices and the global M2 money supply — a measure of the world’s money supply that includes cash, checks, and nearly all convertible currencies.
According to one user, when applying a 110-day offset, there appears to be a consistent pattern between M2 and DOGE price increases — excluding unusual events like the surge following Trump’s election.
If money continues to flow into assets like Dogecoin as global liquidity increases, especially during the summer, this correlation could become even more evident – reinforcing the bullish technical trend.